Your ROAS Is Probably Discount Math, Not Ad Performance
The Number That Looks Like Performance But Isn't
Your Black Friday campaign hit a 7.2 ROAS. The team celebrated. Screenshots got shared. Next quarter's budget got approved on the back of it.
Then January arrived. Revenue down 30%. Repeat purchase rate worse than last year. New customer cohorts are spending less per order than the ones from six months ago. Nobody can quite explain why the "best campaign of the year" was followed by the worst quarter.
Here's the uncomfortable answer: that 7.2 ROAS wasn't measuring how well your ads performed. It was measuring how aggressively you discounted. And those are two completely different things, even though every dashboard in your stack treats them as the same number.
Return on Ad Spend is supposed to tell you a simple story. You put a dollar into ads. You got some dollars back in revenue. Divide one by the other, and you have a clean efficiency metric.
The math is fine. The story it tells is not.
Because ROAS sits at the end of a chain of decisions that have almost nothing to do with your ad creative, your targeting, or your bidding strategy. By the time revenue lands in the numerator, it has already been shaped by your discount stack, your free shipping threshold, your bundling logic, your urgency timers, and whatever the promotions team decided to do that week. A campaign with mediocre ads and a 40% sitewide discount will out-ROAS a brilliantly creative campaign at full price almost every time.
You are not measuring your marketing. You are measuring your margin sacrifice, with marketing attached.
How Discount Math Hijacks the Metric
The hijack happens in three quiet ways, and most teams never notice because each one looks like a win in isolation.
The discount inflates the numerator. When you run a 30% off promo, every order that would have happened anyway now gets credited to whatever ad the customer last clicked. That ad didn't generate the order. The customer was buying regardless. The discount just gave them a reason to do it this week instead of next, and the pixel claimed the trophy.
The promo pulls forward demand. Customers who would have bought in February buy in late January because the deal expires. Your January ROAS looks incredible. Your February ROAS collapses, and the team blames "soft creative" or "platform changes" or whatever post-hoc story fits. Nothing was wrong with February. January just stole from it.
The discount-trained customer is worth less forever. Someone acquired on a 40% off code has, in aggregate, a measurably lower lifetime value than someone acquired at full price. They wait for the next sale. They return more often. They churn faster on subscriptions. Your acquisition ROAS looked great. Your second-purchase rate, your AOV trend, and your retention curve are telling you the real story months later, when nobody is connecting the dots back to the campaign that got celebrated.
Add these three together and you get a picture every growth team eventually faces: ads that look efficient in the platform, a business that feels less efficient every quarter.
The Same Campaign, Two Honest Numbers
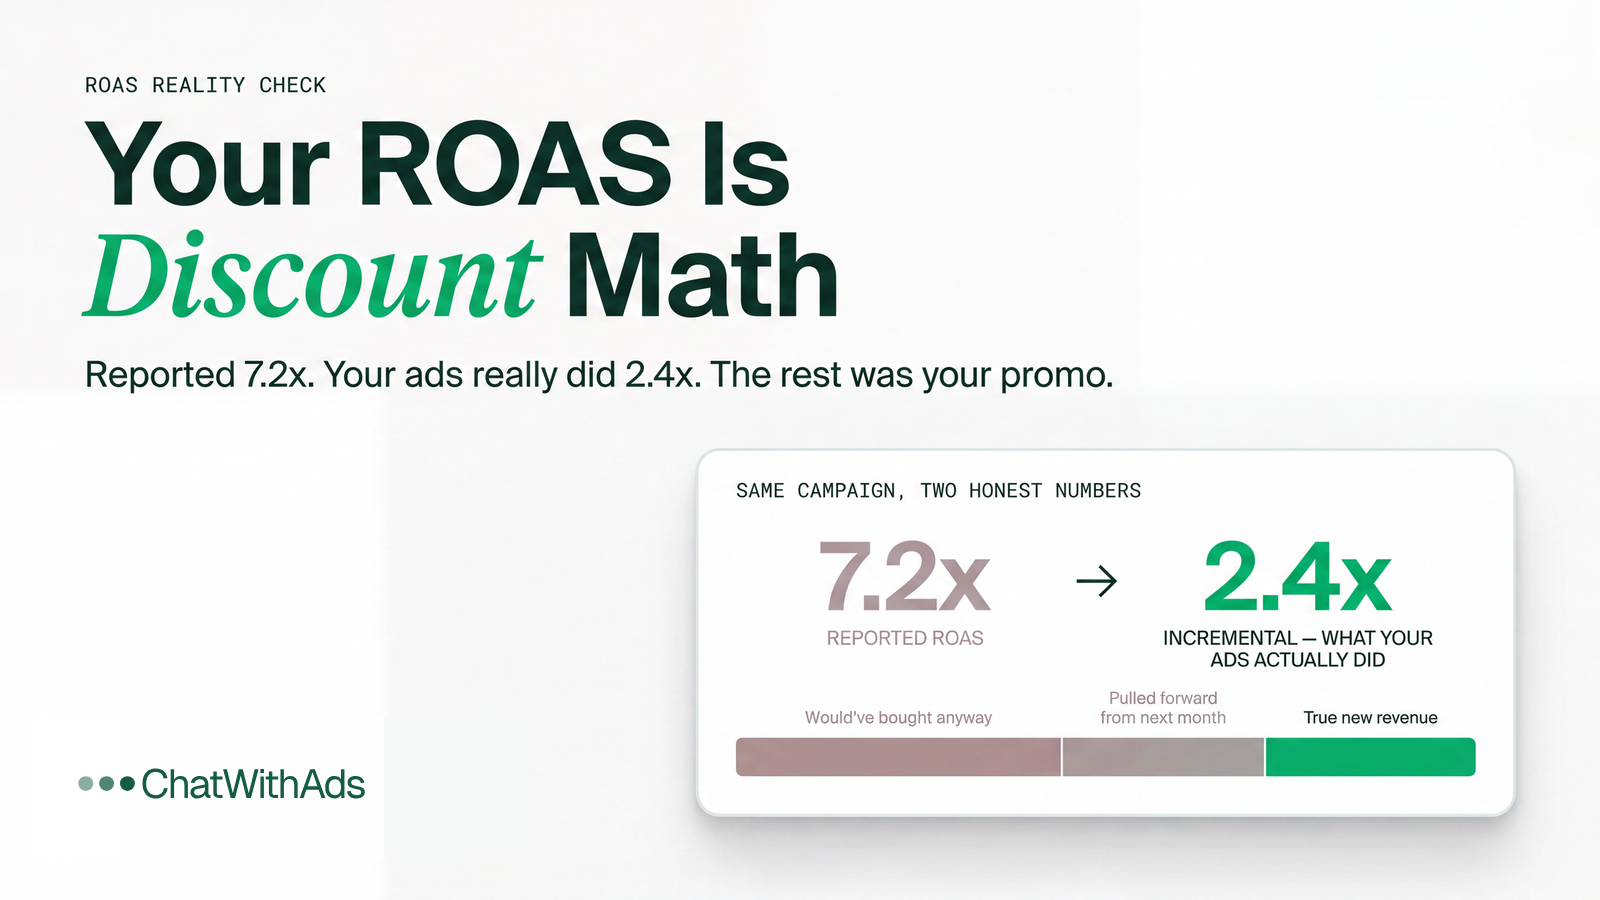
Imagine a campaign that drove $720,000 in revenue against $100,000 in ad spend. Reported ROAS: 7.2. Healthy by almost any standard.
Now strip the story down to what your ads actually did, versus what the discount did.
Of that $720,000, suppose $300,000 came from existing customers who would have purchased anyway, just with a coupon they didn't need to convert. Another $180,000 was pulled forward from the following month revenue you would have earned without the promo, just later. The genuinely new, incremental revenue your ads created? Closer to $240,000.
The honest ROAS for the ad work is 2.4, not 7.2. And the gross margin on that $240,000 after the discount the entire base also received might be thinner than the gross margin on a smaller, undiscounted campaign that posted a "worse" ROAS of 3.1.
This is not an attribution model failing. It is a metric doing exactly what it was designed to do, in a context that was never honest about what it was actually measuring.
Why Platforms Won't Fix This For You
It is tempting to wait for Meta, Google, or your attribution vendor to solve this. They won't. Not because they don't want to, but because they structurally cannot see the inputs that would make the math honest.
Your ad platforms see ad spend and they see attributed revenue. They do not see:
- What discount code was applied at checkout
- Whether that customer was a repeat purchaser or net-new
- What your full-price baseline conversion rate looks like
- How your January cohort behaved in March
- Which orders would have happened with no ad at all
All of that lives in your e-commerce backend, your CRM, your subscription platform, your post-purchase data. The ad platform reports a number from inside its own box. The real story requires connecting that box to the rest of your business, and that connection has historically been someone's quarterly analyst project, not a Tuesday morning question.
Which is why most teams keep optimizing against a number they know, on some level, is misleading them. The alternative pulling exports from four systems, reconciling order IDs, segmenting by promo code, modeling counterfactual demand costs more time than the decision is worth. So everyone agrees to pretend the number means what they wish it meant.
What Honest ROAS Reporting Actually Requires
To turn ROAS from discount math into ad performance, you need to answer a few questions that your dashboard does not currently ask.
What share of attributed revenue is new versus returning? New customer ROAS and blended ROAS are different stories. A 7.2 blended that's actually a 1.8 new-customer ROAS means your ads are subsidizing existing demand, not creating it.
What's the promo overlap? If 80% of your "ad-driven" orders used a discount code, you are not running ads. You are running coupons with ad creative attached. Strip the discount value out of the numerator and see what's left.
What's the lift over baseline? What would have sold this week with no ads running? You can never measure this perfectly, but you can approximate it with holdouts, geo-tests, or simple period comparisons. ROAS without a baseline is a number with no anchor.
What's the downstream behavior of acquired customers? Pull the cohort acquired by each campaign and follow them for 60, 90, 180 days. A campaign with a "low" first-purchase ROAS that produces customers with double the repeat rate is your best campaign, even though every dashboard will rank it near the bottom.
Each of these questions is answerable. None of them are answerable inside the ad platform alone.
Where ChatWithAds Fits In
This is the kind of work that quietly devours a marketing team's week. The data exists. The questions are clear. The bridge between them is what's missing and the manual version of that bridge costs more hours than most teams can spare.
ChatWithAds is built to be that bridge. You connect your ad platforms, your e-commerce or CRM data, and your customer records once. After that, the questions above become a conversation, not a project:
"What was my real new-customer ROAS last month, excluding orders that used a discount code?"
"For the customers acquired during the Black Friday campaign, what's their 90-day repeat rate compared to customers from the previous month?"
"Which campaigns are pulling demand forward versus generating incremental purchases?"
The answers arrive in seconds, in plain language, against your actual data. Not a model's guess. Not a vendor's quarterly readout. Not a dashboard you have to learn how to read. The next campaign decision is made against what the ads actually did, not what the discounts made them look like they did.
That shift changes which campaigns get scaled, which get killed, and how aggressively you discount in the first place. Over time, your team stops chasing a vanity number and starts compounding real customer growth because for the first time, the metric on the screen reflects what's actually happening in the business.
How to Start Auditing Your Own ROAS This Week
You don't need new tooling to begin pressure-testing the number. Three exercises will tell you most of what you need to know.
Re-run last quarter's top campaign with the discount stripped out. Take the attributed revenue, subtract the dollar value of all promo codes applied, and recalculate. If the ROAS drops by more than 40%, your "winning" campaign was mostly a coupon distribution program.
Segment your reported ROAS by new versus returning customer. If you can't do this today, that's the first thing to fix and the gap between the two numbers will probably surprise you. Most accounts find their new-customer ROAS is less than half of their blended figure.
Pick one campaign and follow its cohort for 90 days. Compare repeat purchase rate, AOV on second order, and churn against a baseline cohort acquired without that campaign. A campaign that produces customers who don't come back is a campaign you can't afford, no matter what the first-purchase ROAS says.
The Bottom Line
ROAS is not lying to you. It is doing exactly what the math says it does. The problem is that the math was never designed to separate ad performance from discount performance, and your business needs that separation to make good decisions.
A high ROAS during a heavy promo period tells you the promo worked. It does not tell you the ads worked. Until you can answer that second question cleanly, quickly, against your real customer data you are scaling budget against a number that flatters you in the short term and quietly punishes you for the rest of the year.
Ads should earn their ROAS. Discounts should not be allowed to earn it for them.
Start Free. No credit card. → chatwithads.com
Get the next one in your inbox
Marketing-analytics deep dives like this one, straight to your inbox. No spam, unsubscribe anytime.