Dashboards Don't Answer Why
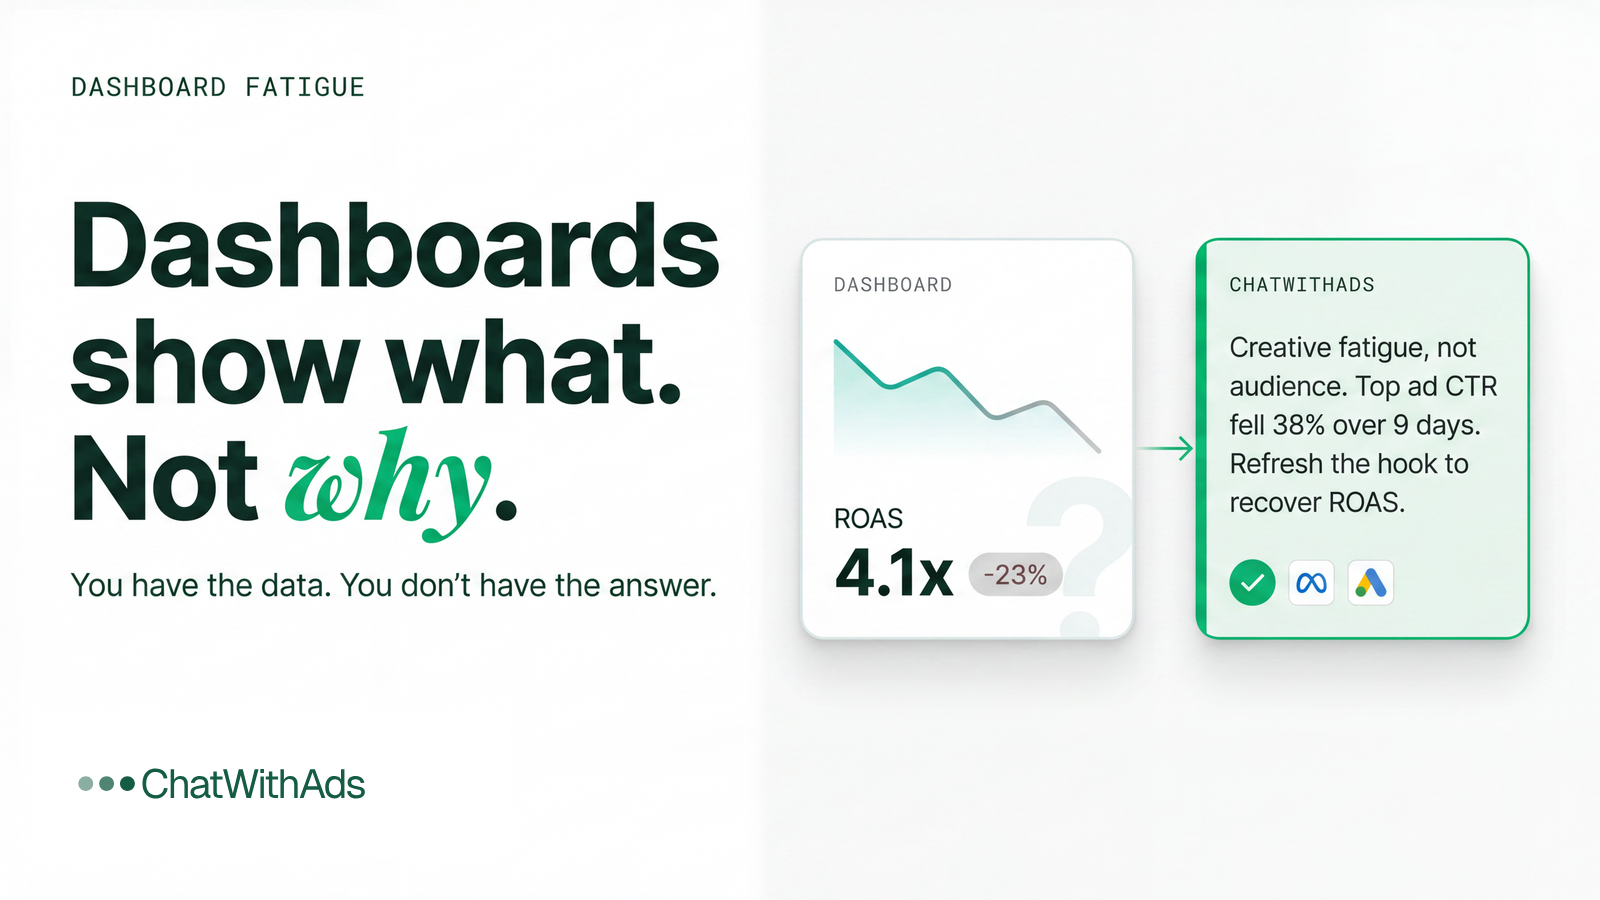
You Have the Data. You Don't Have the Answer.
You've got dashboards for everything.
Analytics platforms showing traffic. Ad managers showing spend. Conversion rate graphs. Revenue breakdowns. Performance metrics updating in real-time.
But when something changes when performance drops, when costs spike, when growth stalls you're still guessing.
The dashboard shows what happened. Not why it happened. Not what to do about it.
This is dashboard fatigue analytics: having all the data and none of the answers.
The Problem Isn't Lack of Information
You already have more data than you need.
Google Analytics, Meta Ads Manager, Shopify, your analytics platform—each one gives you a piece. None of them connect the pieces.
When revenue drops, you're jumping between platforms trying to understand why. Was it the ads? Product mix? Seasonal demand? By the time you've built a theory, the moment to act has passed.
This is tool dissatisfaction not because the tools are bad, but because they show you what happened without explaining why.
What Dashboards Actually Give You (And What They Don't)
Dashboards show you numbers. Conversion rate dropped. Customer acquisition cost went up. ROAS changed.
All true. All visible. None of it explains why.
You know something changed. You don't know what caused it or what to do next. So you dig deeper segmenting data, building custom reports, comparing time periods. You're doing the analysis manually, the work these tools were supposed to handle.
Because the questions that actually matter don't have dashboard answers.
"Why did CAC go up this month?" isn't answered by a CAC graph. You need to know if it's creative fatigue, audience saturation, competitive pressure, or attribution changes.
"Why did profit drop when ROAS stayed flat?" requires understanding product mix, margin compression, and refund rates not just two separate metrics.
"Which channel is driving new customers vs. taking credit for existing demand?" needs incrementality analysis that dashboards don't provide.
These questions require connecting data across platforms, understanding causation rather than correlation, separating what's genuinely changing from what's just attribution noise.
Most ecommerce founders spend hours each week searching for these answers. The dashboards work exactly as designed. They're just not designed to answer the questions that actually matter.
Dashboards give you numbers. You still do all the thinking.
Why This Creates Exhaustion
The promise of modern analytics platforms was easier decision-making.
The reality is easier visibility. But visibility without understanding means you're aware something's wrong without knowing what or why.
This is dashboard fatigue analytics in practice. You're not tired of data. You're tired of data that doesn't help you decide.
You check the dashboard. Something changed. You dig into segments. Compare periods. Export data. Build spreadsheets. Cross-reference platforms. Hours pass. You have a theory. You're not certain. You decide anyway because time's up.
And you're thinking: isn't this what these tools were supposed to solve?
What You Actually Need
You don't need more dashboards. You need understanding.
When ROAS drops, you need to know if it's creative fatigue, audience quality, attribution shifts, or competitive dynamics and which matters most right now.
When cash flow tightens, you need to know which products consume cash vs. generate it, and what happens if you shift budget.
When performance changes, you need to know if it's your campaigns, the market, the product, or timing and what that means for your next move.
The question isn't "what are my numbers?" It's "what do these numbers mean, and what should I do?"
That requires reasoning across disconnected data sources, understanding how variables interact, connecting cause to effect. Dashboards weren't built for that. They display metrics.
How ChatWithAds Changes This
ChatWithAds closes this gap by replacing dashboards with conversation.
Instead of staring at a conversion rate graph trying to figure out why it dropped, you ask: "Why did my conversion rate drop last week?" and get an answer that connects ad performance, product availability, competitive dynamics, and seasonal patterns.
Instead of manually pulling data from five platforms to understand profitability, you ask: "Which products are destroying my margin?" and see exactly which SKUs to cut, which to push, and why.
Instead of guessing whether a campaign is working or just taking credit for existing demand, you ask: "Is this channel incremental?" and get analysis showing real impact.
ChatWithAds doesn't just surface data. It surfaces insights that dashboard fatigue was hiding the connections between metrics, the causation behind correlation, the answer to why things changed and what it means.
It reasons across your advertising performance, product economics, and customer behavior to tell you what's actually happening not just that something happened.
What This Actually Looks Like
When performance drops, you don't need a red arrow. You need to know why it dropped and what options you have.
When planning to scale, you don't need projected revenue. You need to know what it will cost in cash terms and whether you can sustain it.
When evaluating channels, you don't need blended CAC. You need to know what each channel truly costs and which ones genuinely drive growth.
These are questions that matter. They require connecting data most platforms keep separate.
ChatWithAds connects what standard platforms can't ad spend timing with inventory costs, attribution across touchpoints with actual incrementality, revenue performance with cash reality.
Instead of spending hours building analysis manually, you ask what you need to know. Get an answer that helps you decide. Move forward.
The Shift From Visibility to Understanding
Most tools optimize for visibility. More metrics. More graphs. More ways to slice data.
ChatWithAds optimizes for understanding. What changed. Why it changed. What to do about it.
The brands that scale successfully aren't the ones with the most sophisticated dashboards. They're the ones who understand what's happening in their business and can act on that understanding quickly.
Tool dissatisfaction doesn't come from bad tools. It comes from tools that show you everything except what you need to know.
When you're staring at numbers wondering what they mean, you don't need another dashboard. You need the answer to why those numbers changed and what your options are.
That's what ChatWithAds delivers not more data, but the understanding that data should have given you in the first place.
Why This Matters
The gap between having data and understanding what it means is where decisions stall, where opportunities get missed, where problems compound.
Every hour spent manually connecting data across platforms is an hour not spent on the business. Every decision made without full understanding carries unnecessary risk.
ChatWithAds was built for the questions dashboards don't answer the ones that require thinking, not just displaying.
Start free at ChatWithAds.com
Stop staring at dashboards wondering what to do. Start getting answers that actually help you decide. No credit card required.
Get the next one in your inbox
Marketing-analytics deep dives like this one, straight to your inbox. No spam, unsubscribe anytime.